Histogram
Description
Calculates the histogram of an image. Type : polymorphic.
Input parameters
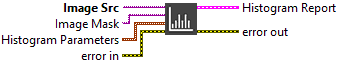
![]() Image Src : class, type accepted U8 and I16.
Image Src : class, type accepted U8 and I16.![]() Image Mask : class, type accepted U8 and I16.
Image Mask : class, type accepted U8 and I16.
![]() Histogram Parameters : cluster,
Histogram Parameters : cluster,
![]() Number Of Class : integer, specifies the number of classes used to classify the pixels. The number of obtained classes differs from the specified amount in a case in which the minimum and maximum boundaries are overshot in the interval range. It is advised to specify a number of classes that is a power of two (for example, 2, 4, or 8) for 8-bit or 16-bit images. The default value is 256, which is designed for 8-bit images. This value gives a uniform class distribution or one class for each grayscale intensity in an 8-bit image.
Number Of Class : integer, specifies the number of classes used to classify the pixels. The number of obtained classes differs from the specified amount in a case in which the minimum and maximum boundaries are overshot in the interval range. It is advised to specify a number of classes that is a power of two (for example, 2, 4, or 8) for 8-bit or 16-bit images. The default value is 256, which is designed for 8-bit images. This value gives a uniform class distribution or one class for each grayscale intensity in an 8-bit image.![]() Minimum Value : float, minimum interval value.
Minimum Value : float, minimum interval value.![]() Maximum Value : float, maximum interval value.
Maximum Value : float, maximum interval value.

Output parameters
![]() Histogram Report : cluster, returns the histogram values.
Histogram Report : cluster, returns the histogram values.
![]() Histogram : array, returns the histogram values in an array. The elements found in this array are the number of pixels per class. The nth class contains all pixel values belonging to the interval [(Starting Value + (n – 1) × Interval Width), (Starting Value + n × (Interval Width – 1))].
Histogram : array, returns the histogram values in an array. The elements found in this array are the number of pixels per class. The nth class contains all pixel values belonging to the interval [(Starting Value + (n – 1) × Interval Width), (Starting Value + n × (Interval Width – 1))].![]() Minimal Value : float, returns the smallest pixel value used in calculating the histogram.
Minimal Value : float, returns the smallest pixel value used in calculating the histogram.![]() Maximal Value : float, returns the largest pixel value used in calculating the histogram.
Maximal Value : float, returns the largest pixel value used in calculating the histogram.![]() Starting Value : float, returns the smallest pixel value from the first class calculated in the histogram. It can be equal to the Minimum value from the interval range or the smallest value found for the image type connected.
Starting Value : float, returns the smallest pixel value from the first class calculated in the histogram. It can be equal to the Minimum value from the interval range or the smallest value found for the image type connected.![]() Interval Width : float, returns the length of each class.
Interval Width : float, returns the length of each class.![]() Mean Value : float, returns the mean value of the pixels used in calculating the histogram.
Mean Value : float, returns the mean value of the pixels used in calculating the histogram.![]() Standard Variation : float, returns the standard deviation from the histogram. A higher value corresponds to a better distribution of the values in the histogram and the image.
Standard Variation : float, returns the standard deviation from the histogram. A higher value corresponds to a better distribution of the values in the histogram and the image.![]() Area (pixels) : float, returns the number of pixels used in the histogram calculation. This is influenced by the values specified in interval range and the contents of Image Mask.
Area (pixels) : float, returns the number of pixels used in the histogram calculation. This is influenced by the values specified in interval range and the contents of Image Mask.

Examples
All these examples are snippets PNG, you can drop these Snippet onto the block diagram and get the depicted code added to your VI (Do not forget to install Computer Vision library to run it).